Debugging `launchd` on OSX 10.10.3
Background
With the recent discovery of some IPC vulns in OSX (one, two, three) digging into the way IPC works in OSX came to the front of my TODO list. That, along with the re-write of launchd for 10.10.x, well, let’s just say it has thus far been a fruitful endeavor - that story is for another post. Which leads me to this post - why would I want to debug launchd?
Mach is the low level functionality within the XNU kernel, which provides IPC between threads and processes; IPC endpoints are referenced via ‘ports’ (unsigned integers). Without going into too much detail about OSX IPC, the flows are very similar to DNS. When one process wants to speak to another process, it queries a special Mach port called ‘bootstrap’ (launchd in the context of OSX IPC) to lookup/provide-access-to the port of the endpoint it would like to communicate. This lookup is done via a string like ‘com.apple.networkd’. launchd responds with a ‘port’ that is used for the destination of future IPC messages. ‘bootstrap’/launchd is the first point of communication when communicating between two processes.
The reason I had an interest in debugging launchd is because I had been able to trigger some crashes. launchd is like init for linux; the kernel spawns it as PID 1 and every process is executed under it. When launchd crashes, the kernel panics, and your machine reboots with the “there was a problem, press any key to continue” screen. User-land triggering kernel bugs is obviously interested due to the trust boundary crossed.
This blog post outlines my thought process (and associated fails) on how I was (kind-of) able to debug a crash in launchd. A quick outline is s follows:
- Attach debugger… FAIL
- Default crash logs… FAIL
- Kernel debugging… FAIL
- Old launchd source… FAIL
- dtrace… SUCCESS YAY (kind of)
- Kernel debugging again (with KDK)… FAIL
- Kernel debug build… YES!
Attach debugger
My first thought was to simply attach a debugger (lldb) to launchd, however after attempting to I received the following message:
~ ➤ sudo lldb -p 1
Password:
(lldb) process attach --pid 1
Process 1 exited with status = -1 (0xffffffff) lost connection

error: attach failed: lost connection
(lldb)
I initially thought this was some anti-debug trick Apple introduced to prevent debugging of the service. However, I got to thinking - if launchd is PID 1, and everything is spawned off of it, then if lldb was able to break lauchd, then lldb should be halted as well - something like the “chicken or the egg” problem. It would be like if you spawned a thread, and then put a breakpoint in the parent, but the thread still was running. It is just not possible.
Default crash logs
Based on some other OSX research I had done in the past, I know there are some default directories where crash logs are stored:
- /Library/Logs/CrashReporter - Where crash data will be stored (similar to the pop-up for “do you want to send these details to Apple”)
- /Library/Logs/DiagnosticReports - Where application/kernel panic logs will be stored
- /var/log/ - Where default application logs are stored
I enabled all possible logging options for launchd, and was unable to find anything useful from the launchd logging output. There were, however, the following:
Kernel panic logs
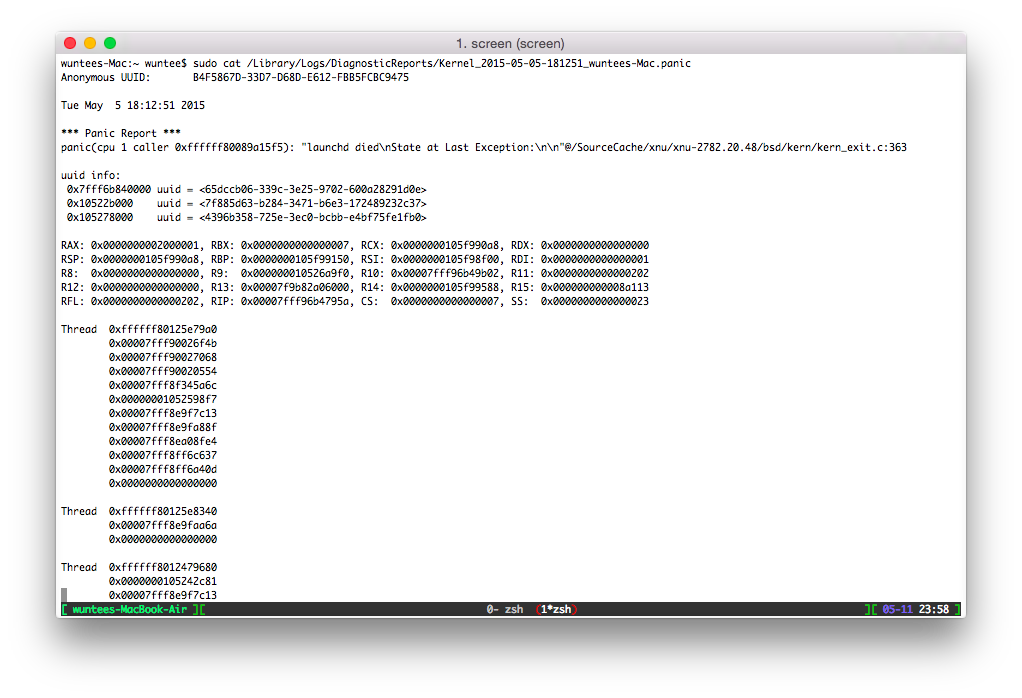
The following file /Library/Logs/DiagnosticReport/Kernel*.panic will show the details of the kernel panic, however it was not very useful as there are just direct memory address references, no backtrace, no function names, no debugging output, etc:
One of the useful things from this is that the crash log refers to a specific file/line of the xnu source describing why the kernel crash had occurred - the kernel will panic if launchd exits, and the bugs I had found cause launchd to crash.
launchd crash logs
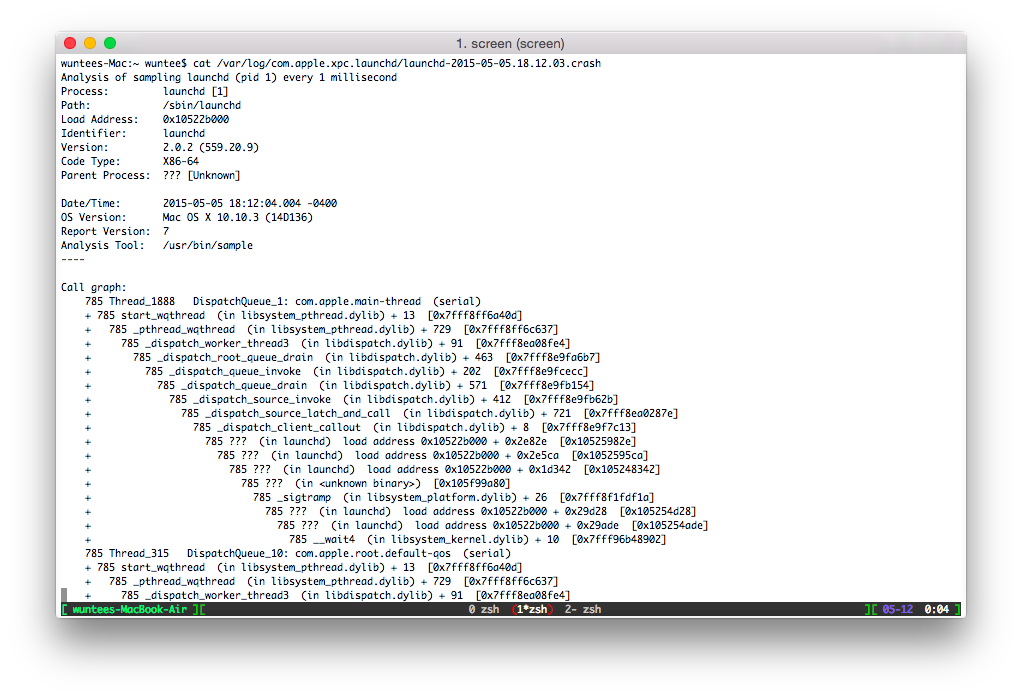
From everything I had read about other launchd crashes, there should be a crashdump file like any other process, however from the launchd re-write, I can only assume Apple had disabled that feature. In turn, you get a semi-useful /usr/bin/sample output located in the /var/log/com.apple.xpc.launchd/ directory. Although this gives a bit more information than the kernel panic, I still am leaps and bounds away from finding the root cause of these crashes.
Kernel debugging
My next thought was to move to kernel debugging, and try and catch the crash before it jumped into the kernel.
Note: At this point in time none of the 10.10.x kernel debug kit (KDK)s were available
In order to enable kernel debugging (on the guest), you must set some specific nvram flags. The flags are just added together to make the final value to set (0x141 = 0x100 + 0x040 + 0x001). Flags are set using the nvram flag=value command.
Note: DO NOT set the ‘nvram boot-args’ with kernel debugging and NOT ARP on a VM - you wont be able to connect via TCP, and you’ll need to find a way of reverting the nvram
| Flag | Description |
|---|---|
| 0x01 | Stop at boot time and wait for the debugger to attach |
| 0x02 | Send kernel debugging output to the console |
| 0x04 | Drop into debugger on a nonmaskable interrupt |
| 0x08 | Send kernel debugging information to a serial port |
| 0x10 | Make ddb the default debugger |
| 0x20 | Output diagnostics information to the system log |
| 0x40 | Allow the debugger to ARP and route |
| 0x80 | Support old versions of gdb on newer systems |
| 0x100 | Disable the graphical panic dialog screen |
There are a useful setups I found:
nvram boot-args "-v debug=0x141"- Verbose, wait for a debugger at bootnvram boot-args "-v debug=0x146"- Verbose, wait for a debugger upon kernel crash/panicnvram boot-args "-v debug=0xd04 _panicd_ip=192.168.121.1"- Verbose, cause a coredump to be transmitted to a panic server (must have a panic server running - directions are in the KDK ReadMe.html file)
When dealing with kernel crashes, having to reboot and re-attach every time became quite annoying, so I found myself using the flags that waited for the debugger upon panic.
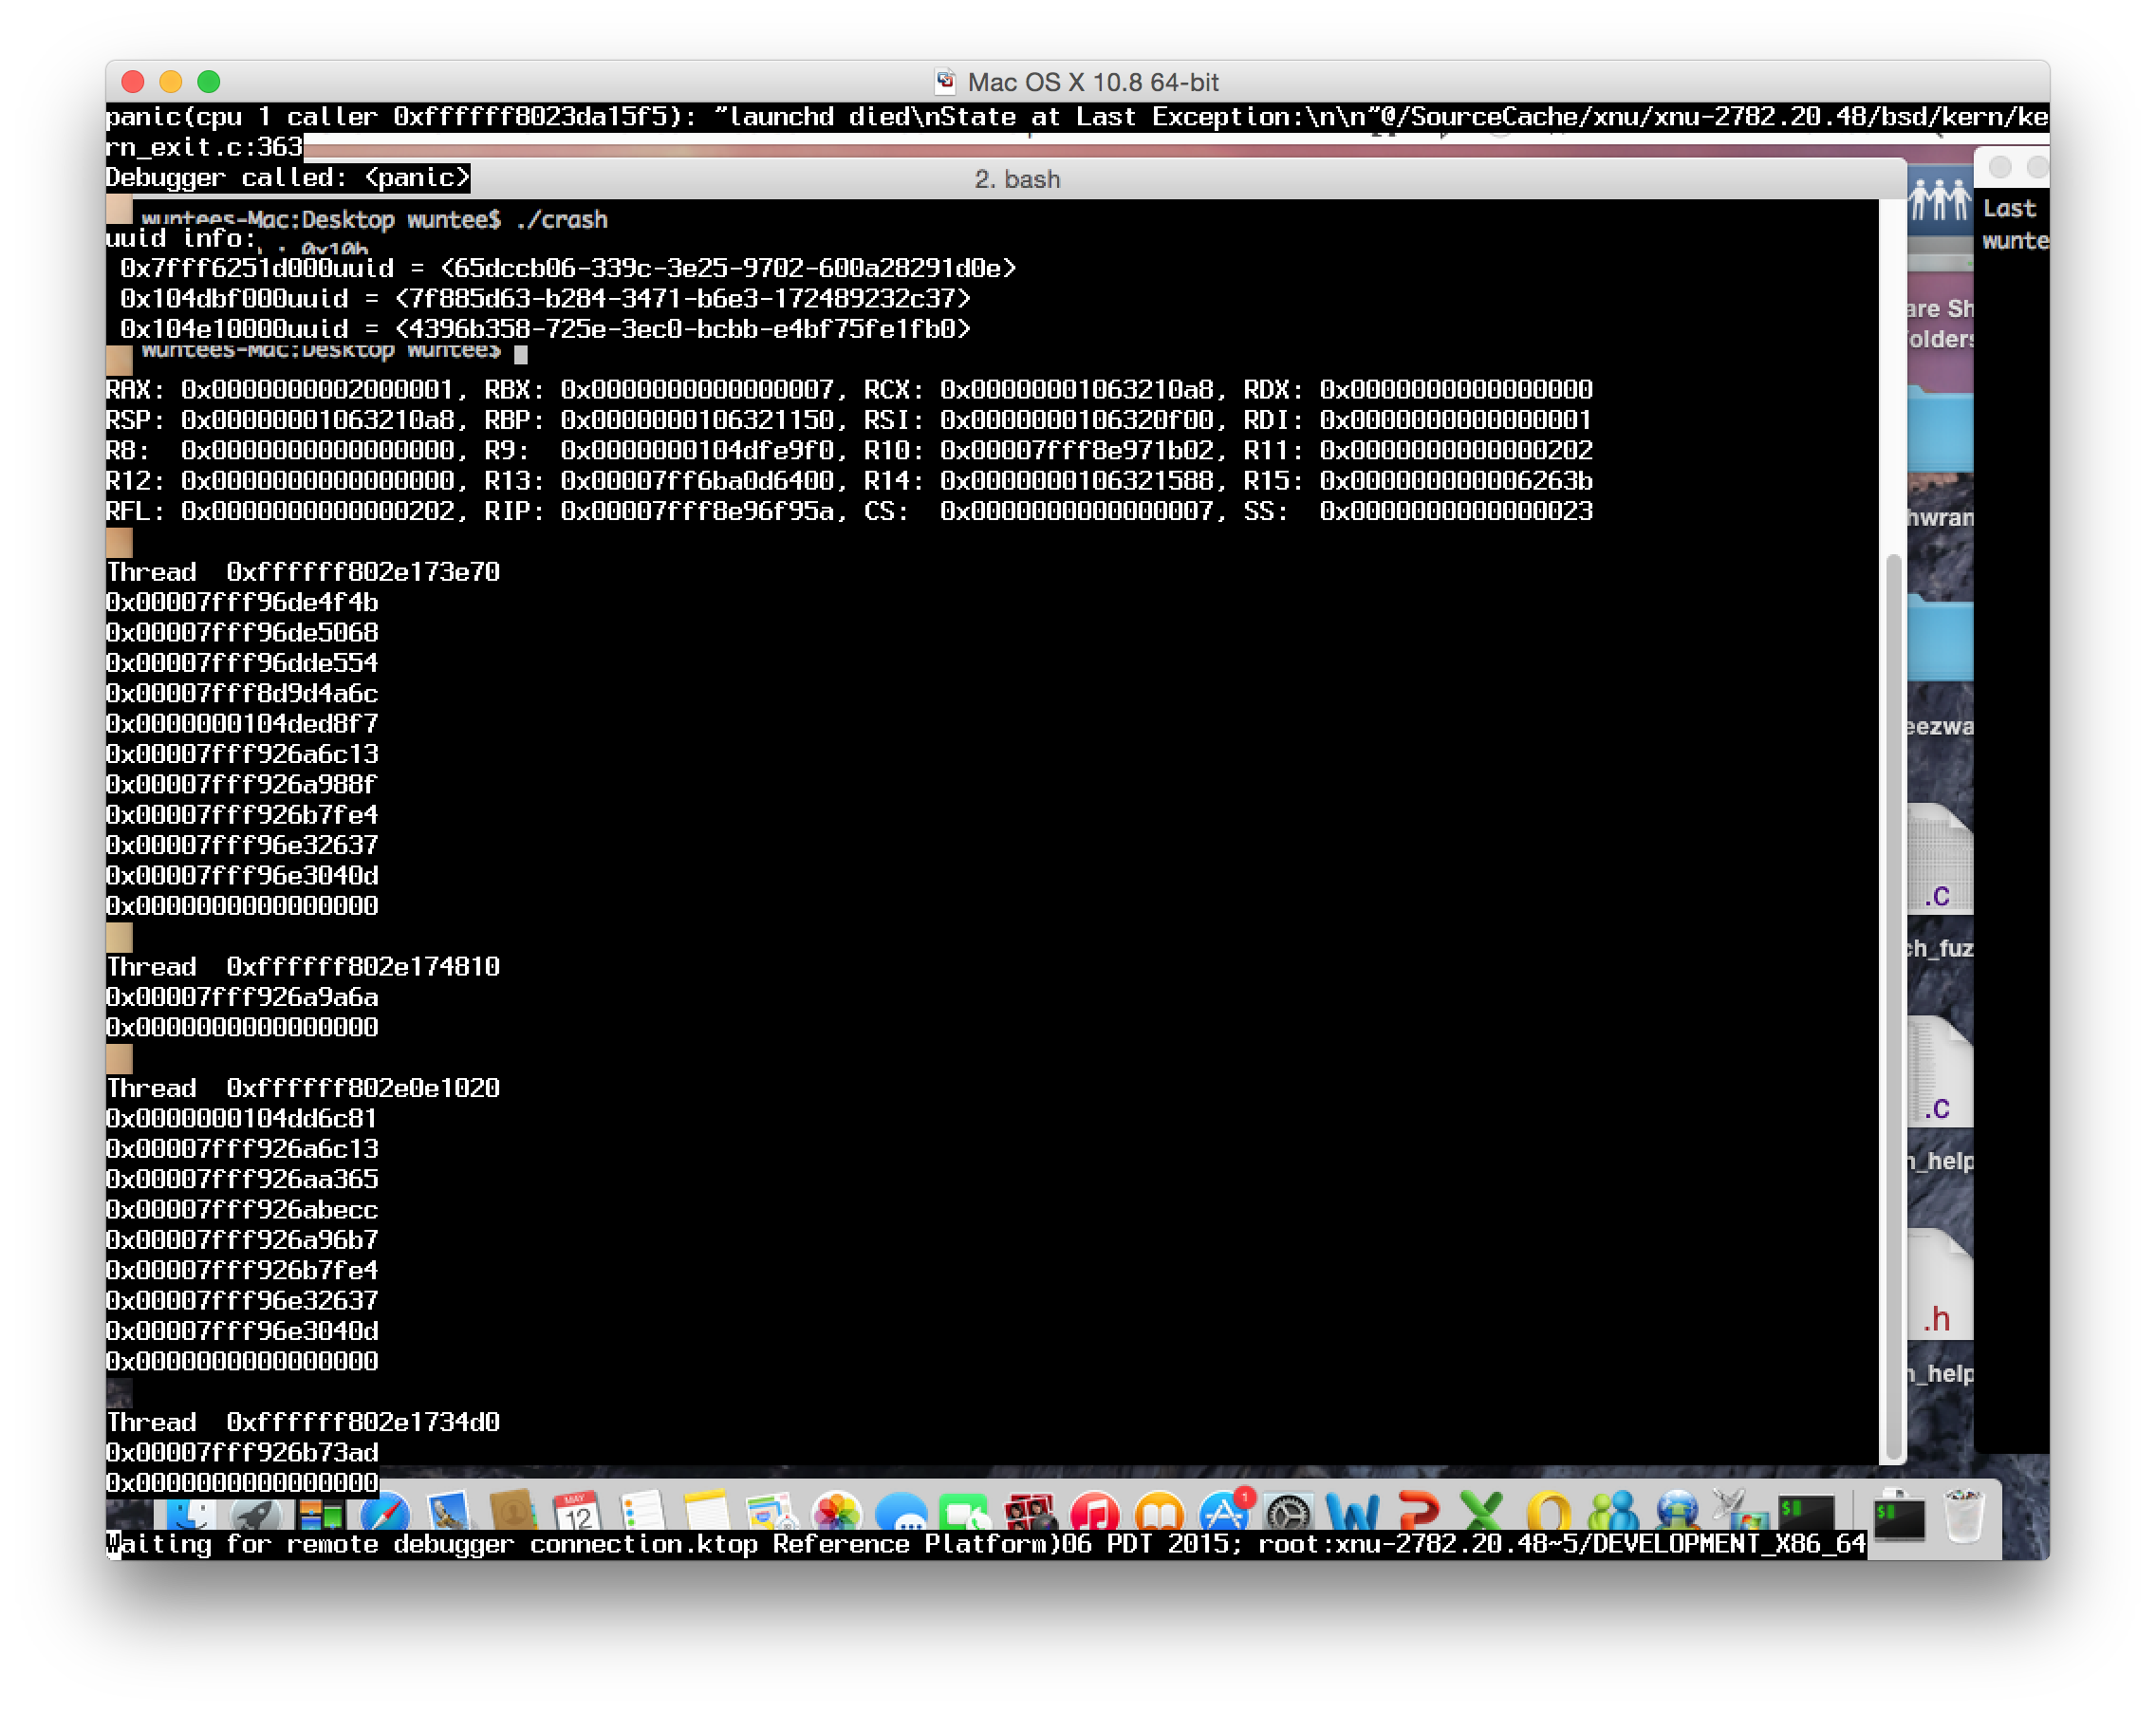
When a crash occurs (I was triggering the launchd bug), the OS/VM should looks something like this (note: the bottom of the screen showing “waiting for debugger”):
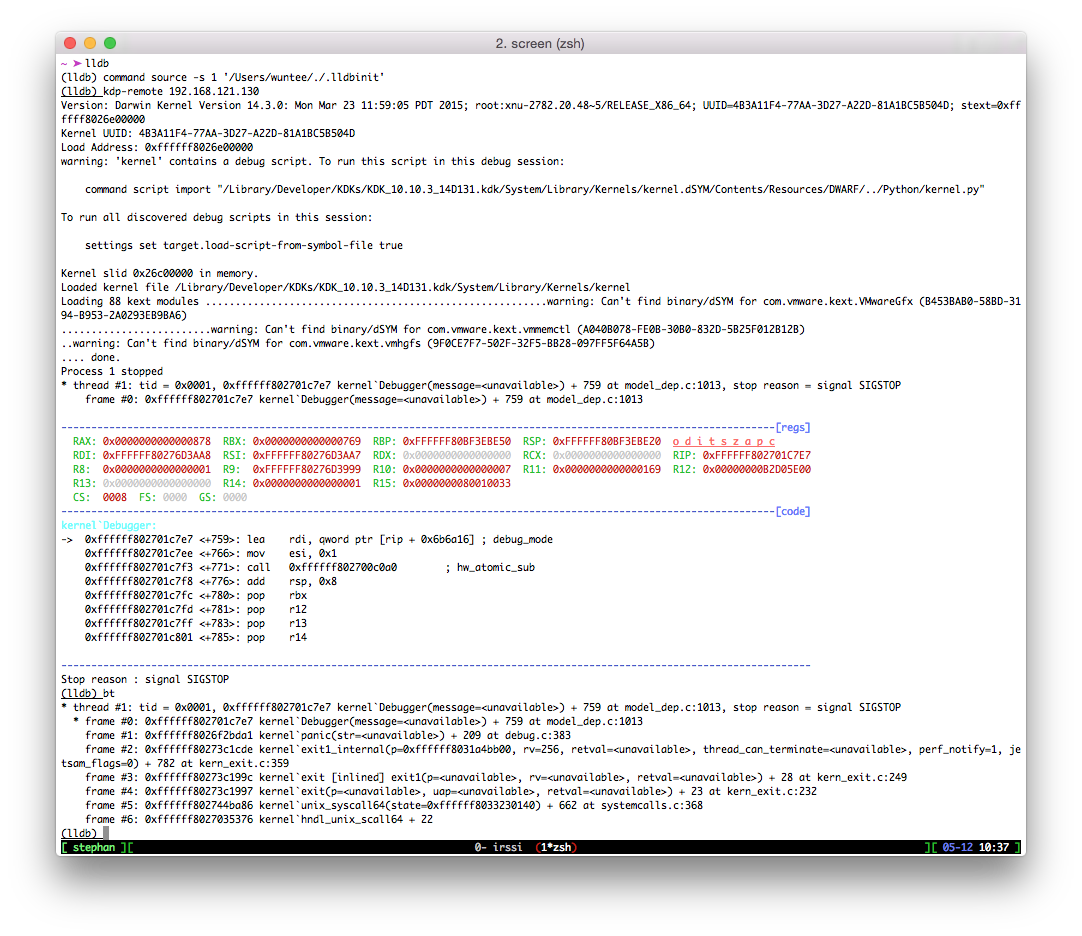
From the host, you can now connect to the kernel debugger via lldb’s kdp-remote command.
Note: Using an lldbinit from deroko to mimic @osxreverser’s gdbinit
When thinking about the kernel, in relation to debugging launchd, the kernel is just a process. More specifically the parent process of launchd. From the backtrace we can see that in the debugger we are in the context of the kernel. This is telling us exactly what the kernel panic error message from the crash said - the kernel panic’ed at kern_exit.c:359. As far as I am aware, after a crash and attaching a debugger to the parent, there is no way of switching the debugger to the context of a spawned/child process. (Although, as I am writing this, there may be some way of causing the kernel debugger to wait upon boot, following threads, and somehow stop following threads when you are in the launchd context - I have not tried this.)
At this point, I started looking into the older kernel debug kit, and noticed there were some additional python libraries/functions for lldb that may allow me to switch context from the kernel to launchd. I spent a little time trying to get 10.9 KDK lldb libraries working on 10.10, but decided to just wait for the 10.10 KDKs to come out.
Old launchd source
While waiting for the 10.10 KDKs to come out, it came to my attention that older versions of launchd have been open sourced (code browser or tarball).
After diving a bit into this older version of the launchd source, it seems that there are a bunch of flags to trigger different debugging behavior; one behavior was that launchd should trap into the kernel debugger. This was exactly what I was looking for, however the version of launchd source was from OSX 10.9, and I was on 10.10. Those flags are:
- Creating the /var/db/disableAppleInternal file
- Creating the /var/db/.launchd_shutdown_debugging file
- Having the nvram boot-args set to verbose mode (
nvram boot-args -v) - Setting the ‘launchd_trap_sigkill_bugs’ value in nvram boot-args (
nvram boot-args launchd_trap_sigkill_bugs)
Unfortunately, none of the above gave me an interactive kernel debuugger for launchd. Upon kernel panic’ing, the debugger would still put me into the context of the kernel. Either I was doing something wrong, misunderstanding the code, or Apple removed this functionality with the re-write of launchd.
dtrace
During the first kernel debugging process, I had an epiphany: dtrace hooks happen at a pretty low level; I know there is a hook to perform actions upon applications exiting/faulting; if, somehow, someway, this fault hook would execute before the kernel panic occurs, I may be able to gain some additional information.
I ran a simple dtrace script to perform a stacktrace on launchd upon it crashing, redirecting the output to a file (this can be done as a one-liner):
#!/usr/sbin/dtrace -s
proc:::fault
/pid == $1/
{
    ustack();
}
And voila! I now had a specific location, within launchd, of where this crash is occurring. That being said, it was still quite hard backtracing to understand exactly why the crash occurred.
CPU     ID                    FUNCTION:NAME
  1   1179                    sendsig:fault ustack

              lib[REDACTED]
              launchd`0x0000000107c248de+[REDACTED]
              launchd`0x0000000107c39478+[REDACTED]
              launchd`0x0000000107c397b1+[REDACTED]
              libdispatch.dylib`_dispatch_client_callout+0x8
              libdispatch.dylib`_dispatch_source_latch_and_call+0x2d1
              libdispatch.dylib`_dispatch_source_invoke+0x19c
              libdispatch.dylib`_dispatch_queue_drain+0x23b
              libdispatch.dylib`_dispatch_queue_invoke+0xca
              libdispatch.dylib`_dispatch_root_queue_drain+0x1cf
              libdispatch.dylib`_dispatch_worker_thread3+0x5b
              libsystem_pthread.dylib`_pthread_wqthread+0x2d9
              libsystem_pthread.dylib`start_wqthread+0xd
Kernel debugger again (with KDK)
Apple releases Kernel debug kits (KDKs) with each version of their kernel. These packages provide debug/developer builds of the kernel, along with lldb scripts/functions/tools to help in debugging kernel/driver code. While performing the previous research, there was no KDK available for my version of OSX.
Once I noticed that the 10.10.x KDK’s have been released, I pulled and installed. My first thought was that some of the additional python libraries would allow me to get more insight into launchd, and possibly switch context from kernel to launchd. Unfortunately that was not the case, but there are some very interesting features of the KDK python scripts/functions for lldb. The location of these scripts are /Library/Developer/KDKs/*/System/Library/Kernels/*.dSYM/Contents/Resources/Python
Now, these additional tools did not provide any help to me while debugging launchd there are a WHOLE BUNCH of them and felt it worth noting.
To include these script, follow the instructions when attaching the debugger:
~ ➤ lldb
(lldb) command source -s 1 '/Users/wuntee/./.lldbinit'
(lldb) kdp-remote 192.168.121.130                                                                                                                               Version: Darwin Kernel Version 14.3.0: Mon Mar 23 11:59:06 PDT 2015; root:xnu-2782.20.48~5/DEVELOPMENT_X86_64; UUID=2EE700C9-D676-3A2F-8BA4-1682C8EE47E3; stext=0xffffff800e800000
Kernel UUID: 2EE700C9-D676-3A2F-8BA4-1682C8EE47E3
Load Address: 0xffffff800e800000
warning: 'kernel' contains a debug script. To run this script in this debug session:

    command script import "/Library/Developer/KDKs/KDK_10.10.3_14D131.kdk/System/Library/Kernels/kernel.development.dSYM/Contents/Resources/DWARF/../Python/kernel.py"
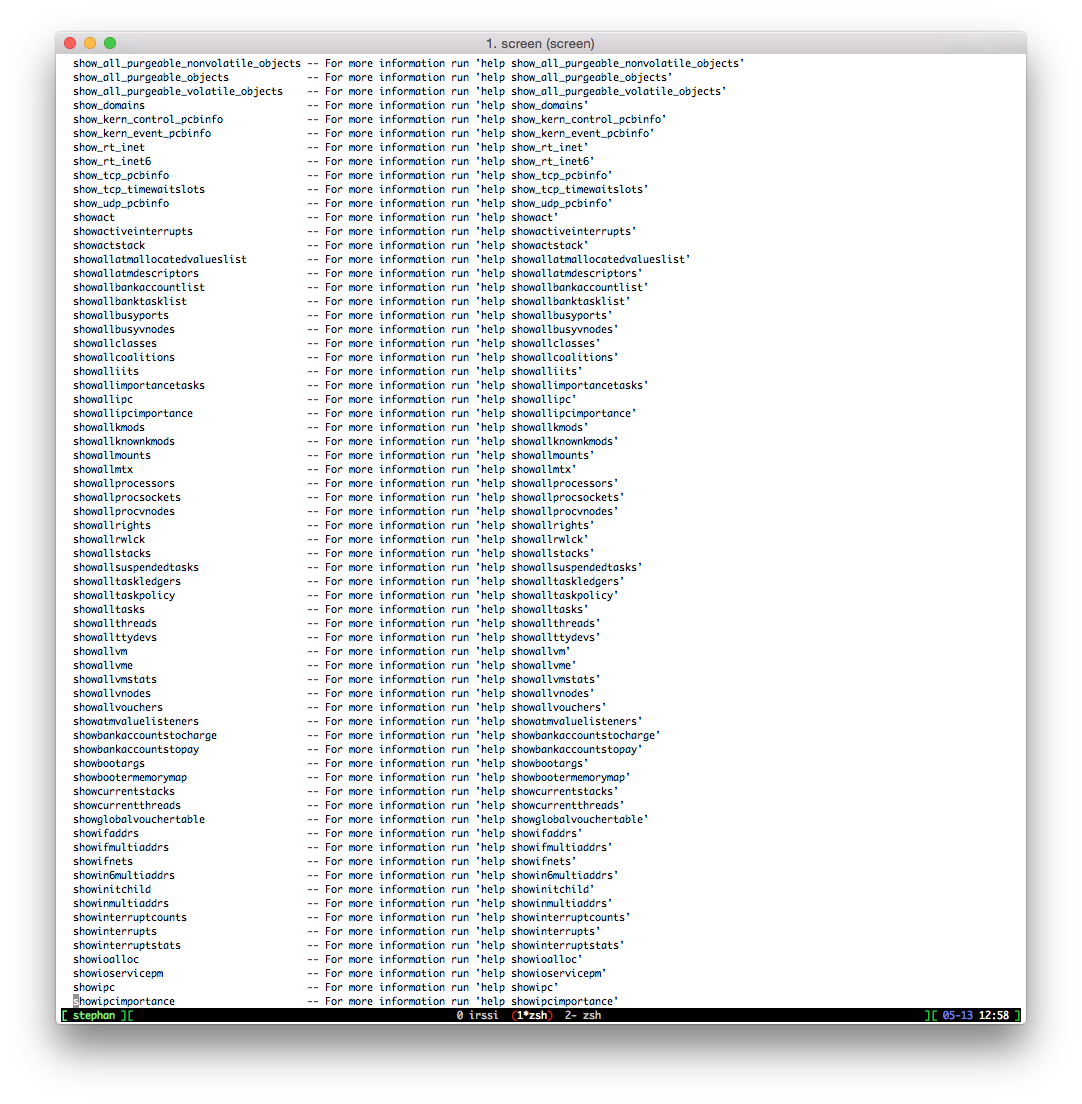
Just from viewing the help command, you can see how much additional functionality has been introduced (this is only a small segment):
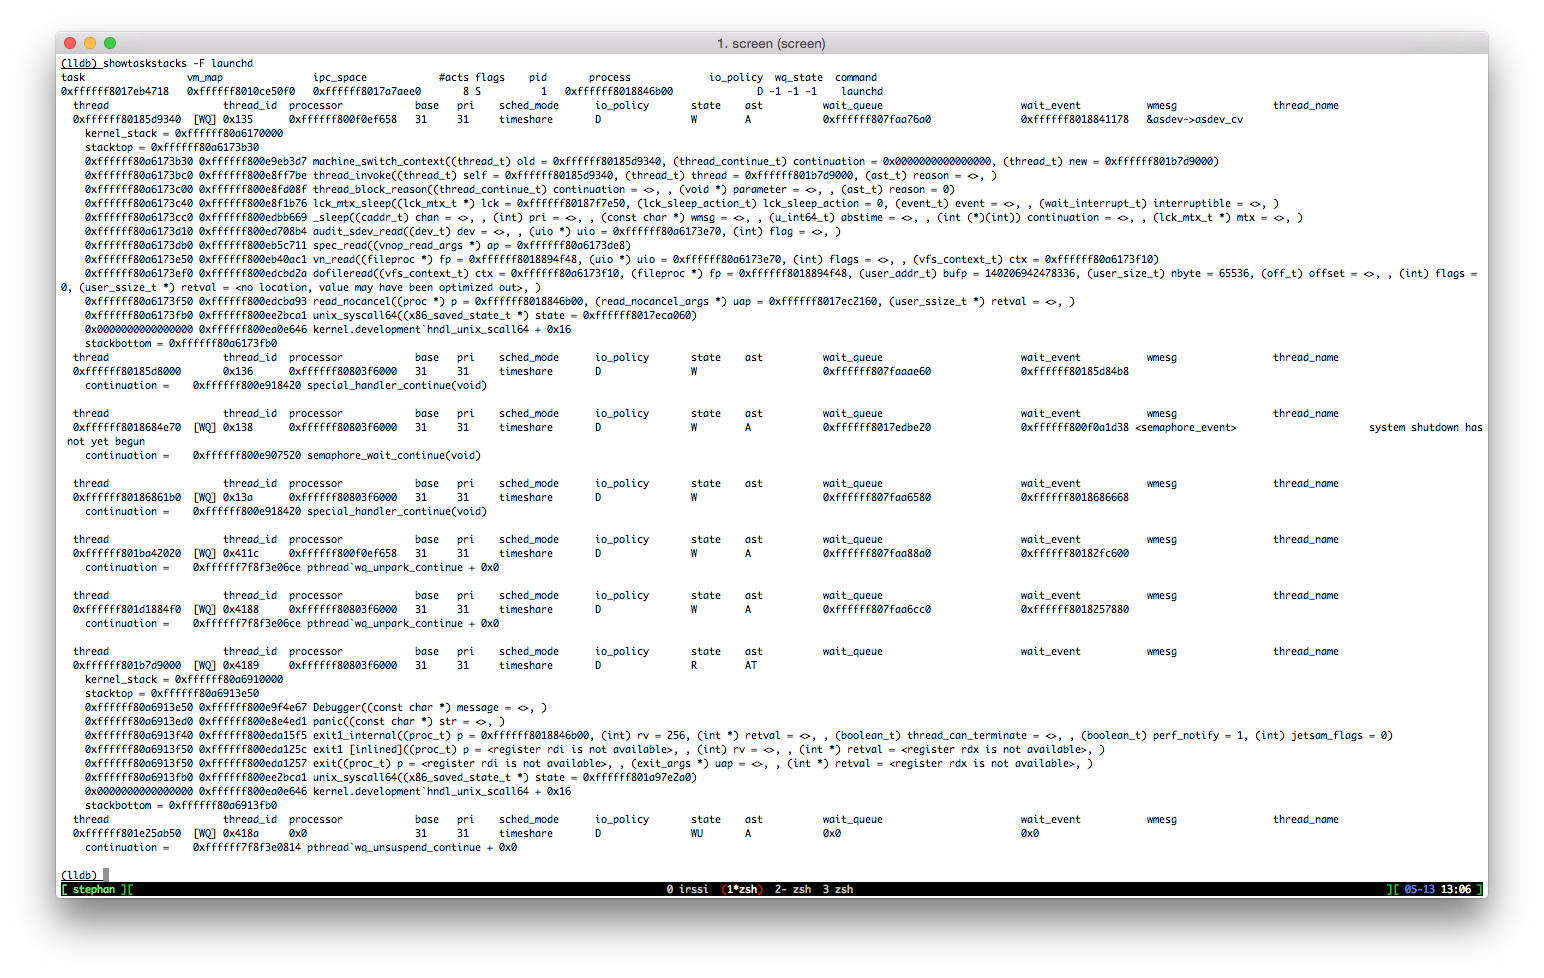
While writing this, I noticed some functions that may be of some benefit. Specifically showtaskstacks -F launchd, however the backtrace shows that it has jumped/switched context into the kernel debugger. This may not be a lost cause; I did spend too much time here.
Kernel debug build
After the kernel debug kit came out, and a second look at the XNU source, I noticed something very interesting near the kernel crash:
#if (DEVELOPMENT || DEBUG)
int err;
/*
 * For debugging purposes, generate a core file of initproc before
 * panicking. Leave at least 300 MB free on the root volume, and ignore
 * the process's corefile ulimit.
 */
if ((err = coredump(p, 300, 1)) != 0) {
	printf("Failed to generate initproc core file: error %d", err);
} else {
	printf("Generated initproc core file");
	sync(p, (void *)NULL, (int *)NULL);
}
#endif
panic("%s died\nState at Last Exception:\n\n%s",
					(p->p_comm[0] != '\0' ?
						p->p_comm :
						"launchd"),
					init_task_failure_data);
It looks like, if you are running a DEVELOPMENT or DEBUG build of the kernel and launchd crashes, the kernel will perform a coredump of launchd somewhere. After a little more sifting through the XNU source, the file should exist in ‘/cores/core.[PID]’.
The ReadMe.html in the KDK (/Library/Developer/KDKs/*/ReadMe.html) has details on how to install/run a DEVELOPMENT/DEUG kernel. After following that, triggering the crash, and rebooting I finally found a golden nugget - there was a file at ‘/cores/core.1’!
Note: DO NOT try and run a developer/debug kernel for a different version of OSX - it wont work, your kernel wont boot, and you’ll have to find a way of reverting (I WAS DESPARATE!)
Opening the core.1 file with lldb (lldb /sbin/launchd -c core.1) I can finally at least dynamically debug the crash. Which, unfortunately seems to be a null pointer dereference, however I haven’t fully debugged the root-cause to understand full impact.
(lldb) disassemble -a $rip
lib[REDACTED].dylib`[REDACTED]_get_type:
    0x7fff8f075201 <+0>: mov    rax, qword ptr [rdi]  ** Crashes here **
    0x7fff8f075204 <+3>: ret
(lldb) register read $rdi
     rdi = 0x0000000000000000
Note: Some information is [REDACTED] because I have not reported any associated bugs. Once they are reported/fixed, [REDACTED] information will be removed
